

API performance testing in 2026 starts with a tool decision. The market has twenty-plus credible options spanning open-source frameworks, managed cloud platforms, and the newer wave of traffic-replay tools. Pick one that fits your team and stack, and load testing becomes a routine part of every release. Pick the wrong one, and the tests sit unused in your repo while production keeps surprising you.
This guide walks through how to choose, without the vendor bias. You’ll get a five-question decision tree, profiles of six web API performance testing tools that actually deserve consideration this year, and the patterns that consistently sink API performance work before it starts.
Before any tool conversation, settle one thing first. The real decision is whether to build with open-source, buy a managed platform, or hire someone who’s made this call a hundred times. The answer depends on your team, your stack, and how often performance has to be tested rather than checked once before launch. The questions below resolve that fork before you commit to a logo.
Five Questions That Pick the Tool for You
Most articles list API performance testing tools alphabetically and let you sort it out. That’s backwards: tools serve teams, not the other way around. Answer these five questions in order, and the shortlist narrows itself.
Can Your Team Write Tests in Code?
Pick a language your engineers already work in: JavaScript, Python, Scala, or Java. Code-as-test tools live in your repo, run in your pipeline, and review like any other pull request. GUI-first tools need a separate workflow and a different skillset. If your team can write a unit test, they can write a load test in code. If they can’t, GUI tools waste less time than asking developers to learn a new paradigm just to push buttons.
Do You Want Tests to Run Automatically on Every Code Change?
If yes, the tool needs to run from a command line (not a desktop app), automatically fail the build when performance drops below your thresholds, and report results back to your pipeline. k6, Gatling, and Artillery were built for this. JMeter can do it but takes more setup. Anything that requires opening a desktop app to run a test is automatically out for automation testing pipelines.
What's Your Peak Traffic Target?
Peak traffic for an API is measured in requests per second, or RPS — the number of calls hitting your server every second under load. Three brackets cover almost every case:
- Up to 5,000 RPS: almost any tool runs from a single load generator.
- 5,000 to 50,000 RPS: you need distributed load generation, self-hosted or via cloud service.
- Above 50,000 RPS: options narrow to managed platforms or significant in-house infrastructure.
Does Test Data Have to Stay in Your Cloud?
Regulated industries (finance, healthcare, defence) often can’t ship production-shaped payloads to a SaaS load tester. Self-hosted k6, JMeter, or Gatling keep traffic inside your perimeter. Managed platforms vary on data residency, so check before scoping. This question also affects cost: SaaS tools price on virtual user hours, while self-hosted tools price on infrastructure.
Which Protocols Are In Scope?
REST is universal across the category. Any credible option qualifies as performance testing tools for REST API work. Support for other protocols diverges sharply:
- k6: HTTP, gRPC, WebSocket, Kafka natively.
- JMeter: nearly everything via plugins (HTTP, JDBC, JMS, SOAP, FTP).
- Gatling: HTTP and JMS by default, more through extensions.
- Specialty protocols (MQTT for IoT, AMQP for messaging) often force the tool decision before any other criterion.
Six API Performance Testing Tools Worth Your Time in 2026
Out of the twenty-plus options on the market, six earn a place on a serious evaluation. They cover every realistic path through the decision tree above and represent the best tools for API performance testing 2026 that hold up against real engagements.
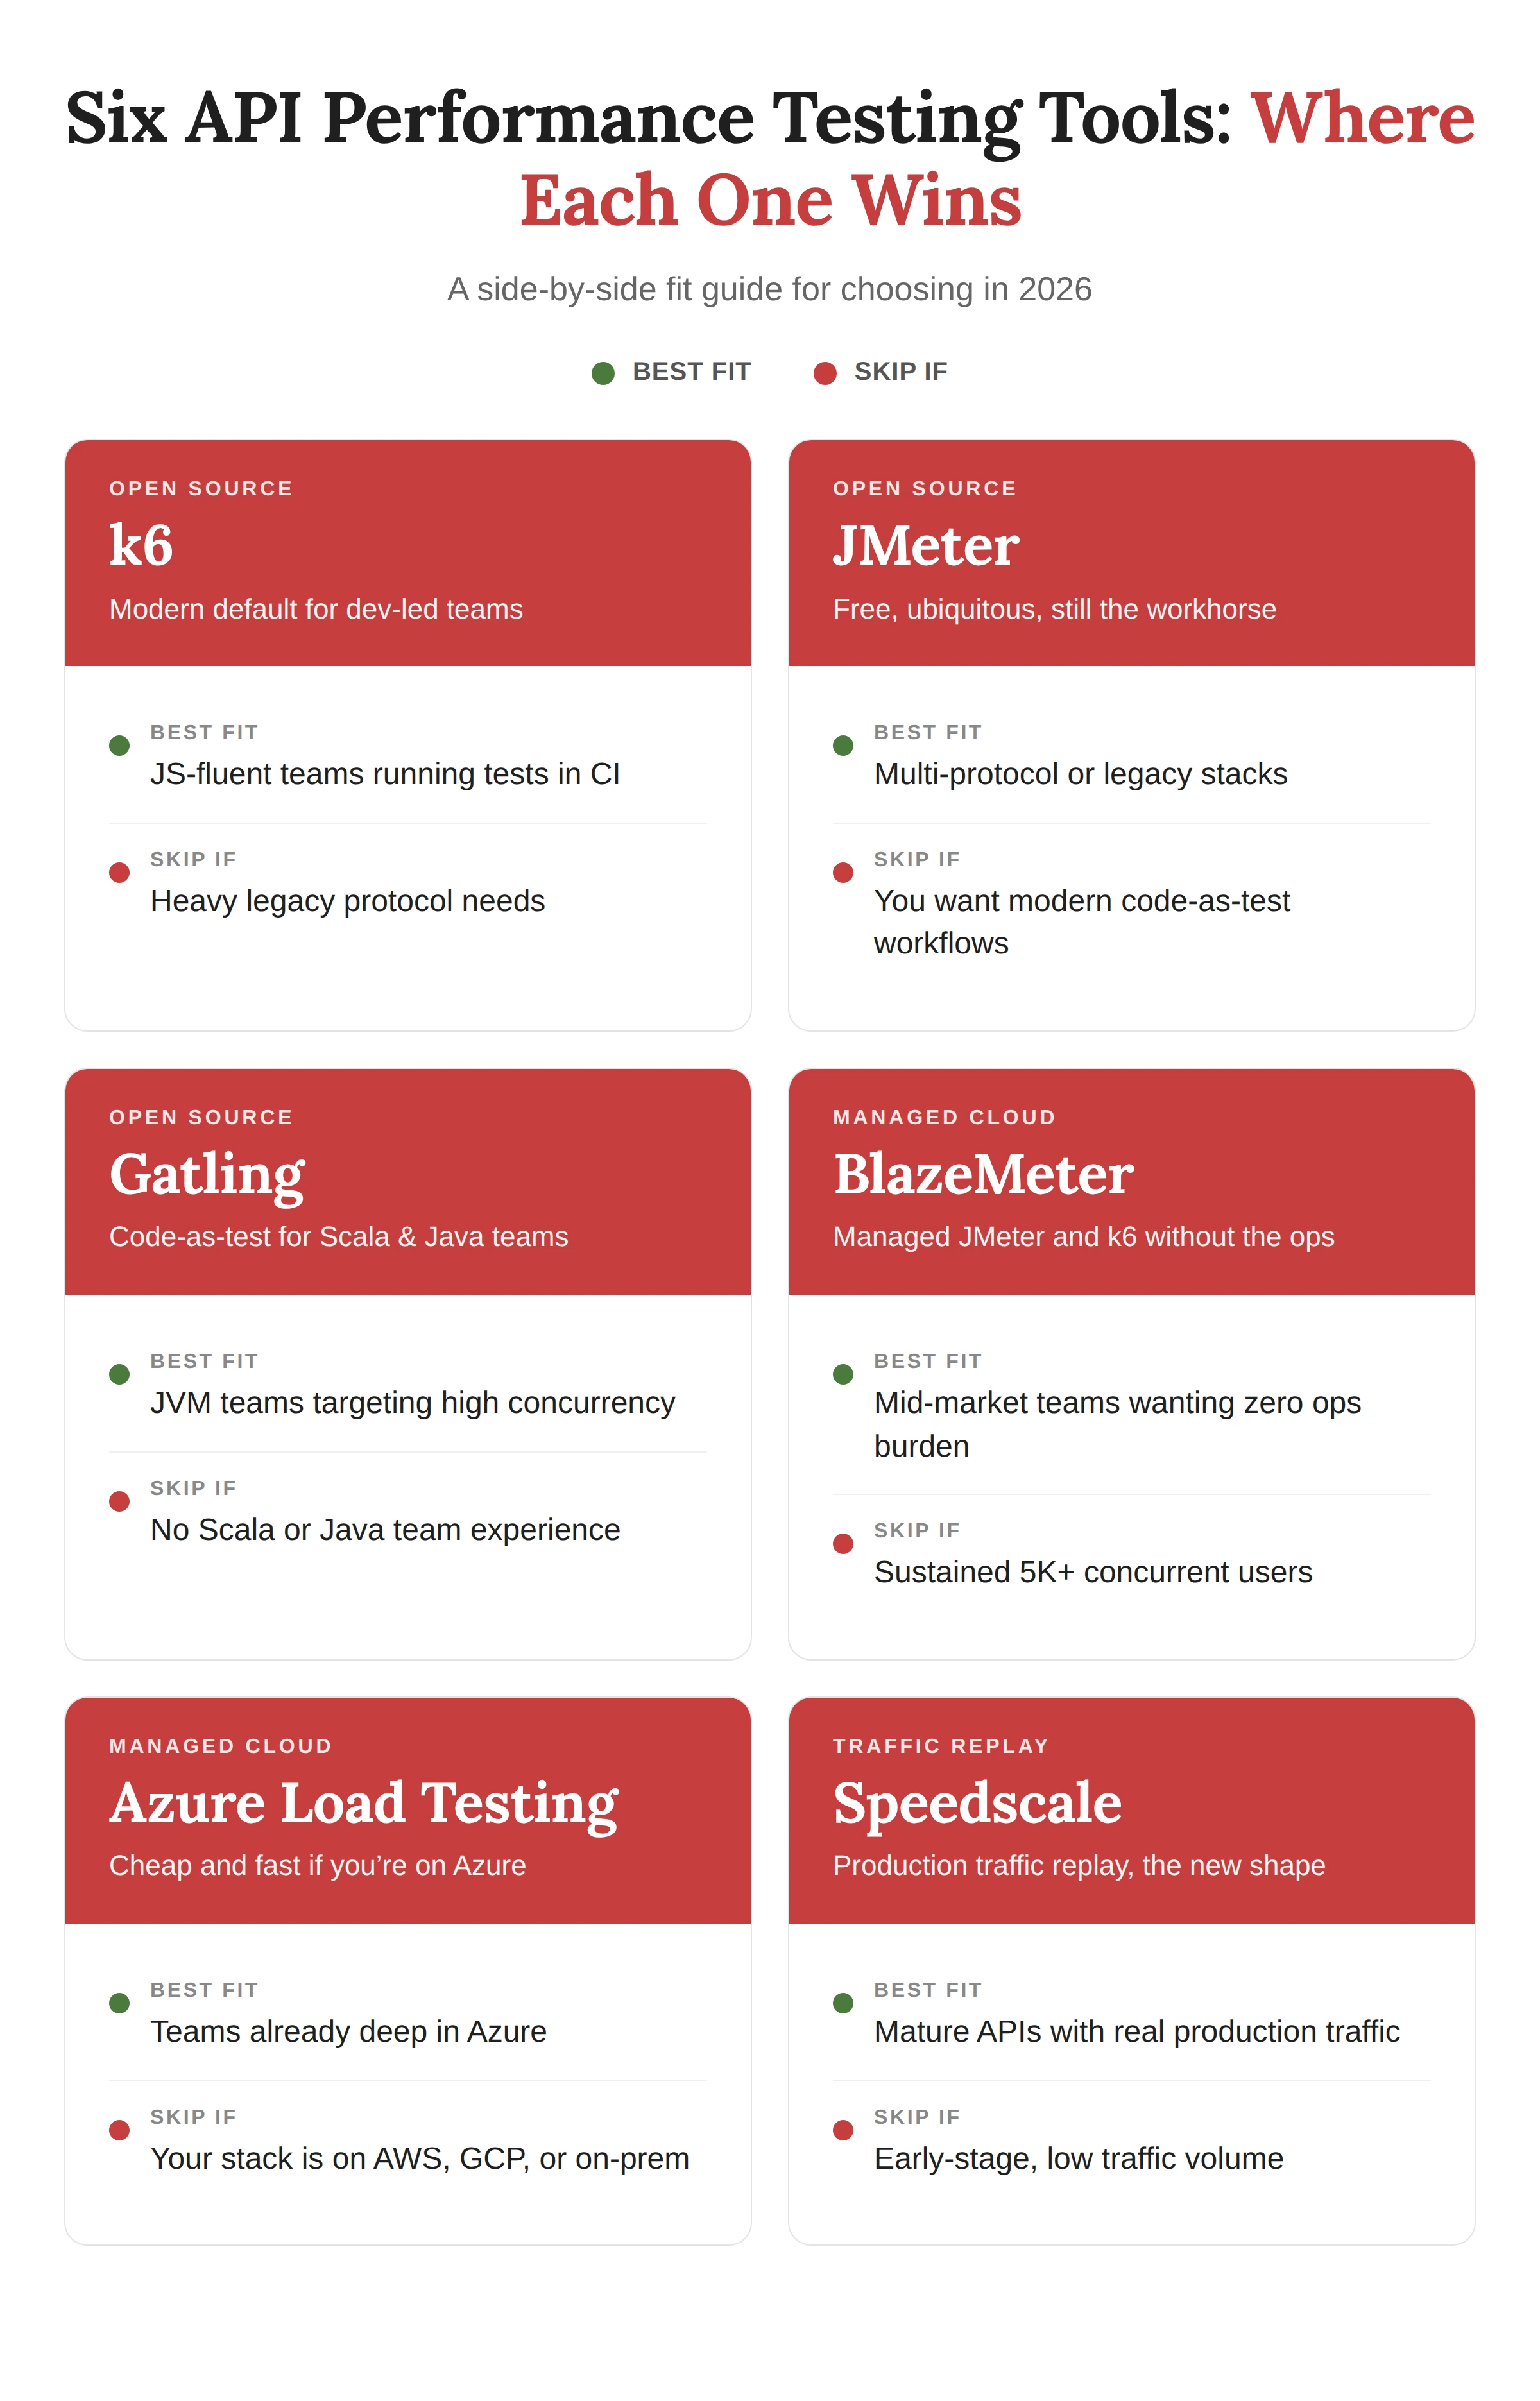
k6
The modern default for dev-led teams. The closest thing to a default choice in 2026. JavaScript scripting, single-binary install, native CI integration, and tight Grafana observability since Grafana Labs acquired the project. Best for engineering teams comfortable in JS who want tests in Git. It offers a free open-source core.
- JavaScript scripts that engineers can write and review like any other code.
- Native CI/CD integration with build-failing exit codes.
- Tight Grafana observability and Prometheus integration.
- Low memory footprint (~100 KB per virtual user).
- Active development backed by Grafana Labs.
- HTTP-focused, with weaker support for legacy enterprise protocols.
- Cloud pricing tied to virtual user hours plus metrics storage.
- Distributed runs require Grafana Cloud k6 or self-managed Kubernetes setup.
JMeter
Free, ubiquitous, still the workhorse. Apache JMeter has been the open-source default since 1998 and isn’t going anywhere. Massive plugin ecosystem, broad protocol coverage, and zero licensing cost. Best for teams testing legacy stacks or multi-protocol environments where flexibility matters more than developer ergonomics.
- Completely free with no enterprise licensing tier.
- Plugin support for almost every protocol you’d encounter (HTTP, JDBC, JMS, SOAP, FTP).
- Enormous community and decades of tutorials, plugins, and recipes.
- Mature reporting with HTML dashboards out of the box.
- GUI-heavy by default, awkward to run in CI without extra wiring.
- JVM memory overhead (~1 MB per virtual user) limits single-node capacity.
- Test plans stored as XML, harder to review in pull requests than scripted alternatives.
Gatling

Real code-as-test for Scala/Java teams. High-performance Scala-based tool (Java DSL also available) built for engineering teams that want load tests reviewed like any other code. Excellent CI integration, low resource footprint, and Gatling Enterprise for distributed runs.
- Highly performant under high concurrency, with low resource usage per virtual user.
- Real code-as-test in Scala or Java, version-controlled and reviewable.
- Excellent built-in HTML reports with response-time percentiles.
- Strong CI/CD support and Kubernetes-native deployment via Gatling Enterprise.
- Scala learning curve for teams not already in the JVM ecosystem.
- Enterprise features (distributed runs, advanced reporting) sit behind a paid tier.
- Smaller plugin ecosystem than JMeter for niche protocols.
BlazeMeter
Managed JMeter and k6 without the ops. Perforce-owned cloud platform that runs JMeter, k6, Selenium, and Gatling scripts at scale without you provisioning infrastructure. Best for mid-market teams that want enterprise-grade reporting without hiring a dedicated performance engineer. Both free tier and paid plans exist.
- Runs JMeter, k6, Gatling, and Selenium scripts on managed infrastructure.
- Distributed load generation across global regions with one configuration.
- Polished reporting and dashboards out of the box.
- Free tier sufficient for small projects and proof-of-concept work.
- Pricing scales fast above 5,000 concurrent virtual users.
- Abstracts away infrastructure details some performance engineers want visibility into.
- Vendor lock-in risk for teams that go all-in on proprietary features.
Azure Load Testing
Cheap and fast if you’re already on Azure. Microsoft’s managed service runs JMeter and Locust scripts on Azure infrastructure with native Application Insights integration. Best for teams already living in the Azure ecosystem.
- Unusually cheap pricing for managed cloud load testing.
- Native integration with Application Insights and Azure Monitor.
- Runs both JMeter and Locust scripts without modification.
- Provisioning takes minutes if your account is already on Azure.
- Azure-only, with no value if your stack runs on AWS, GCP, or on-premise.
- Reporting less polished than BlazeMeter or Grafana k6 Cloud.
- Limited protocol support compared to running JMeter directly.
Speedscale

Traffic replay, the new shape of perf testing. Captures real production traffic and replays it as load tests, removing the guesswork of synthetic scenario building. Best for teams with mature production traffic that don’t trust hand-written scenarios to match reality. Pricing is custom and lands in enterprise-tier territory.
- Tests built from real production traffic.
- Catches edge cases hand-written scenarios miss.
- Strong fit for microservice architectures with complex inter-service calls.
- Kubernetes-native deployment.
- Requires meaningful production traffic and observability before it pays off.
- Custom enterprise pricing rarely makes sense for early-stage products.
- Less mature ecosystem than k6 or JMeter.
What Changed in API Performance Testing in 2026
Three shifts separate the 2026 landscape from how teams approached API performance work just two or three years ago. AI now drafts test scripts that engineers used to write by hand. OpenTelemetry has emerged as the dominant open standard for observability instrumentation, displacing the vendor-specific agents that dominated earlier years. And traffic replay, once a Netflix-tier experiment, now ships as a credible alternative to synthetic scenario building. None of these is hype. Each one shows up in every credible vendor roadmap and every internal RFP we’ve seen this year.
AI-Assisted Test Scenario Generation
Tools now generate baseline test scripts from OpenAPI specs, Postman collections, or recorded traffic. According to McKinsey’s analysis of AI in software development, nearly 80% of organizations now use generative AI in at least one business function, and software engineering ranks among the top areas where AI delivers measurable cost reductions. The savings show up in onboarding time, not test quality. Humans still need to review what the model produces and tune thresholds against real performance baselines.
OpenTelemetry Becomes the Default Instrumentation Layer
OpenTelemetry has become the de facto standard for collecting traces, metrics, and logs across modern stacks, with major cloud vendors and enterprises aligning on it for vendor-neutral instrumentation. Modern performance testing API tools correlate load test results with OTel traces automatically, which means you stop guessing which downstream service caused the p95 latency spike. Teams without OTel instrumentation in 2026 are working with one hand tied behind their back.
Traffic Replay Goes Mainstream
Speedscale, GoReplay, and a handful of smaller entrants have made production-traffic replay viable for teams below the Netflix tier. The pitch is simple: tests built from real traffic don’t lie about what users actually do. Adoption is uneven across mid-market teams, but the category has clearly graduated from experiment to credible alternative within the past eighteen months.
Common API Performance Testing Mistakes
We’ve watched the same five mistakes show up across enough engagements to recognize them on sight. Each one looks small in isolation and expensive in aggregate:
- Testing localhost and calling it done. Local tests reveal nothing about production latency, network behavior, or downstream dependencies. Run tests against an environment that matches production topology.
- Running happy paths only. Real traffic is messy: invalid payloads, expired tokens, slow database queries, retries from impatient mobile clients. Tests built only from the happy path miss the failure modes that actually take APIs down. The REST API testing checklist covers the negative cases worth scripting alongside the positive ones.
- One pre-launch test instead of continuous CI runs. Performance is a regression problem. Without automated functional testing running on every meaningful change, the next slow query slips in unnoticed and surfaces in production. Pre-release pressure testing catches launch-day issues; continuous CI catches the drift in between.
- Picking a tool your team can’t read. A perfect tool nobody on the team is fluent in produces worse tests than an imperfect tool everyone understands. Match the tool to your team’s actual code skills.
- Confusing performance testing with synthetic monitoring. Synthetic checks tell you if the API is up. Load tests tell you what happens when traffic spikes. Both matter, and neither replaces the other. The right performance testing program uses both alongside production observability.
When to Bring in an API Performance Testing Partner
If you’ve read this far and you’re still unsure which path fits, that’s a reasonable place to land. API performance work has one of the highest ratios of leverage to expertise in software testing. A team that’s run twenty load tests sees patterns that a team running their first one cannot.
The math is also straightforward. A senior performance engineer in-house runs well into six figures fully loaded in North America, plus tooling and ramp-up time. A specialist QA partner delivers the same expertise on a per-engagement basis, without the salary commitment or the risk of choosing the wrong tool stack on the first pass. The trade-off worth weighing:
- Build in-house if performance is a permanent product concern and you have continuous load to test.
- Buy a managed platform if your team can write the scripts but doesn’t want the infrastructure burden.
- Hire a partner if you need senior expertise on a project basis without long-term salary commitment.
QAwerk has run load and performance work across REST, GraphQL, and gRPC stacks since 2015, on every tool listed above. We can also fold this into a broader API testing engagement if you’d prefer end-to-end coverage. If you’d rather hand the decision tree to people who’ve walked it many times, contact us and we’ll scope your project.
FAQ
What is API performance testing?
API performance testing measures how an application programming interface behaves under load. It evaluates response times, throughput, error rates, and resource consumption when many concurrent requests hit endpoints simultaneously. The goal is to identify bottlenecks, confirm scalability targets, and validate that an API meets its service-level agreements before users feel the failure.
What is the best API performance testing tool in 2026?
There is no single best tool. The right choice depends on your team’s coding skills, CI requirements, peak RPS targets, and protocol mix. For most engineering-led teams in 2026, k6 has emerged as the default. JMeter remains the strongest open-source choice for legacy or multi-protocol stacks. Use the decision tree above to narrow yours.
What is the difference between k6 and JMeter?
k6 is a modern, code-first tool with JavaScript scripting and native CI integration, built for engineering teams. JMeter is older, GUI-driven, and supports a broader range of protocols through plugins. k6 uses less memory per virtual user and integrates with Grafana observability natively. JMeter handles more legacy protocols out of the box but takes more setup for CI workflows.
Can Postman be used for API performance testing?
Postman added a built-in performance testing feature in 2023, suitable for quick checks on small endpoints with up to 100 virtual users. For serious load testing beyond that scale, or for CI-integrated regression testing, a dedicated tool like k6 or JMeter is the better choice. Postman fits early-stage validation, not production-scale stress testing.
See how QAwerk stress-tested a card-issuing API end-to-end with test automation, helping the fintech ship reliably and secure $15M in seed funding