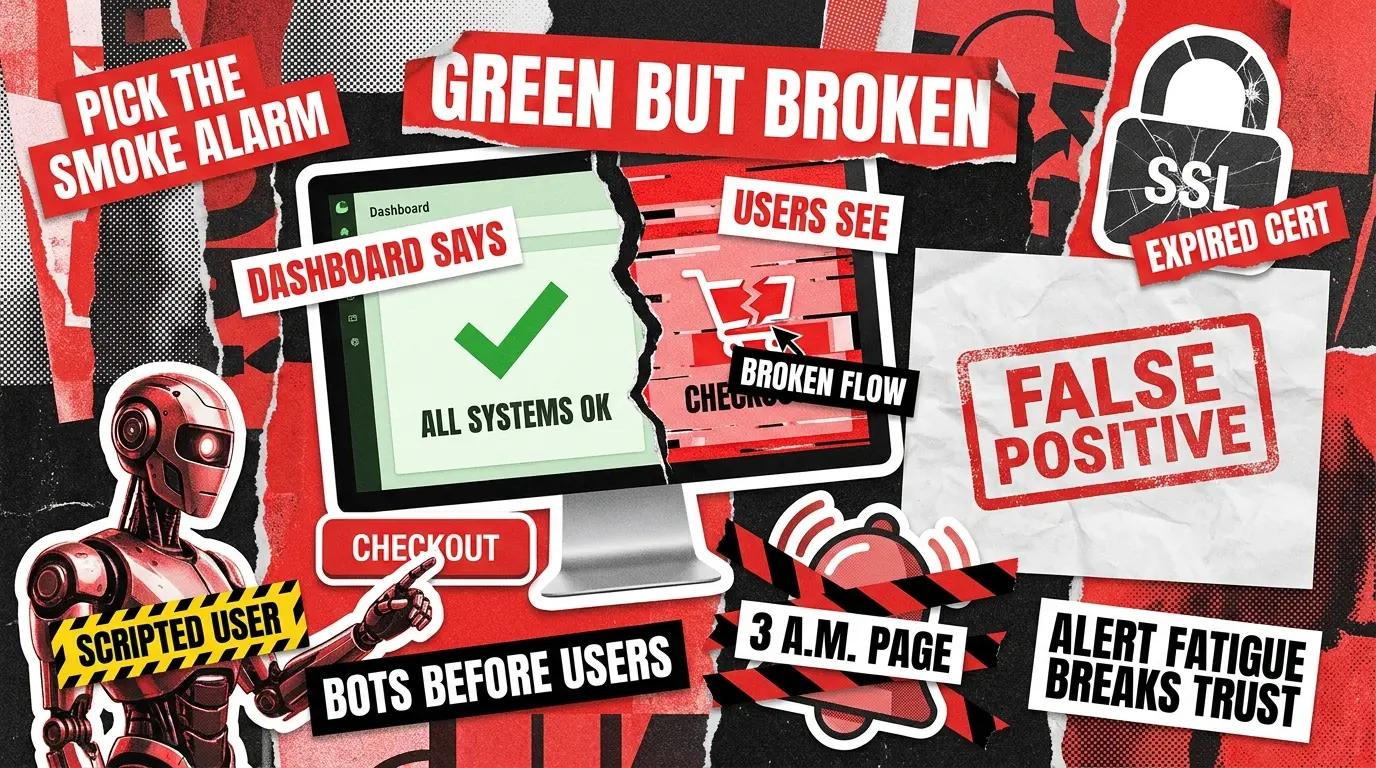
A single broken checkout flow that no one notices until 9 a.m. is the difference between a quiet morning and a panicked Slack channel. Uptime Institute’s 2025 Annual Outage Analysis reports that IT and networking issues now account for 23% of impactful outages, a number that keeps climbing as architectures get more distributed. That gap between “something broke” and “someone noticed” is exactly what synthetic monitoring tools are built to close.
Most lists comparing the best synthetic monitoring tools are written by the people who sell them. This one is written from the QA engineering side: the people who script the transactions, triage the alerts, and explain to the CEO why a green dashboard still missed the outage. The picks below are evaluated for what they catch in real production, how they behave when your team scales, and what they will do to your on-call rotation by day 90.
What Synthetic Monitoring Actually Catches
So, what is synthetic monitoring in plain terms? It is scripted bots simulating real user flows against your production environment, on a schedule, from multiple geographic locations. The bots log in, click through a checkout, hit an API, and assert that the response matches what your code is supposed to return.
What it catches well: dead pages, broken API contracts, third-party SDK failures, expired SSL certificates, and regressions in critical user journeys after a deploy. Synthetic transaction monitoring sits at the heart of that capability, validating multi-step flows rather than single endpoints. What it misses: real users on flaky mobile networks, accessibility gaps, and bottlenecks that only appear under genuine concurrent load. That last category is where deeper performance testing belongs. The cleanest mental model is to think of synthetic monitoring as a smoke alarm and performance testing as the fire drill.
The other distinction worth getting straight is synthetic monitoring vs real user monitoring (RUM). Synthetic is proactive and controlled, RUM reflects what your actual customers experienced. The two are complements, not alternatives. Most mature teams run both, and most outage post-mortems point at the gap between them as the spot where the incident hid for hours.

Synthetic Monitoring vs. Test Automation: Where They Overlap
Every QA lead eventually asks the same question: can we just re-point our Playwright suite at production and call it monitoring? Technically yes. Practically, almost never.
Test automation and synthetic monitoring share scripting languages, browser engines, and many of the same engineers. They differ on everything else that matters in production. Frequency, alerting, retry logic, geographic distribution, and the handling of test data turn into different problems the moment you cross from staging to live. A flaky test in CI annoys a developer. A flaky monitor at 3 a.m. pages four people and trains the on-call team to ignore the alert channel.
Purpose
Validate a build before release
Detect production failures continuously
Frequency
Per commit or per PR
Every 1 to 15 minutes, 24/7
Environment
Staging or ephemeral
Production
Failure handling
Block the merge
Page on-call
Data state
Reset between runs
Must survive in live data
The honest middle ground is to share the scripting layer. Several teams running modern automated testing reuse their Playwright page objects across both CI tests and synthetic checks, which cuts maintenance roughly in half and is one of the strongest arguments for picking a code-native platform over record-and-playback.
What to Look For in Synthetic Monitoring Software
Buying decisions in this category go sideways for one of two reasons. Either the team picks a tool that looks great in a demo and falls apart at 500 checks, or they pick the simplest option and outgrow it inside six months. Use the seven criteria below, in priority order, when you compare synthetic monitoring software:
- Multi-step transaction support. URL pings are table stakes. The real value sits in scripted flows that log in, navigate, and assert state across several pages.
- API check chaining. Modern apps fail at the seams between services. The tool should chain calls, pass tokens between them, and assert on response bodies.
- Real browser engine. Playwright-based or Puppeteer-based engines beat DIY headless Chrome for stability and modern web feature support.
- Geographic coverage that matches your customers. Twenty regions sound impressive until none of them are where your users actually live.
- Monitoring as code. Terraform, a CLI, or an SDK becomes non-negotiable past 20 checks. Anything click-driven turns into technical debt by month three.
- Smart alert routing. Look for “X of Y locations failing” logic. Single-location flakes are the number one cause of alert fatigue.
- Predictable scaling. Watch how the tool behaves as check volume and locations grow. Some platforms quietly add friction at scale that only shows up after the contract is signed.
The Shortlist: 7 Synthetic Monitoring Tools Worth Your Time
The market for synthetic transaction monitoring tools is crowded, with Gartner’s 2025 Magic Quadrant tracking 20 observability vendors and the broader observability software segment growing at roughly 12% annually. The seven tools below earn their seat at the table for synthetic checks specifically, rather than as a side feature of a bigger platform.
Checkly
Built around Playwright and a code-first workflow, Checkly is the developer favorite for teams that want their monitors living in Git alongside the app. Browser checks, API checks, and heartbeat monitors all run from a single SDK, and the same script that runs in CI can run as a production monitor.
The catch is operational maturity. Status pages, on-call routing, and incident management are thinner than what dedicated incident platforms offer, so most Checkly users pair it with PagerDuty. Best fit: dev-heavy product teams shipping daily who already invest in Playwright.
Datadog Synthetics
If your team already runs Datadog for APM, logs, and infrastructure metrics, Datadog Synthetics is the path of least resistance. The tight correlation between a failing synthetic check, a backend trace, and the underlying host metric is genuinely useful during an incident, because the responder lands in one tool instead of stitching three together.
The catch is platform gravity. As a bolt-on to an existing Datadog account, Synthetics is excellent. As a standalone choice for a team not already in the ecosystem, it brings a heavy learning surface. Best fit: scale-ups and enterprises already inside the Datadog ecosystem.
New Relic Synthetics
New Relic’s strength is in correlating performance regressions with business outcomes. A 200 ms slowdown showing up next to a measurable dip in conversion rate is the kind of view that turns a technical metric into a board-ready chart. For teams that need to defend reliability investments to non-technical stakeholders, that visibility matters.
The catch is platform density. Onboarding takes longer than competitors, and the UI rewards engineers who spend time learning it. Drop-in usage by an occasional contributor is harder than on lighter tools. Best fit: teams that want one platform spanning APM, RUM, and synthetic, with an engineer who can own it.
Dynatrace
Dynatrace earns its place in any list of synthetic monitoring solutions through Davis AI, which does genuine automated root cause analysis rather than the alert correlation most competitors market under the same name. For complex distributed systems, the time saved during incident triage is the differentiator, and the audit trail it produces is useful in regulated industries.
The catch is the deployment footprint. Dynatrace is built for large estates and rarely the right pick for a 15-person engineering team running a single product. Best fit: regulated industries, large enterprise estates, and teams where a single hour of downtime crosses six figures.
Better Stack
Better Stack rolled synthetic checks, status pages, on-call scheduling, and incident management into a single product. For small teams without a dedicated SRE function, the value of one tool and one dashboard is hard to overstate. The status page handles customer-facing communication during incidents without extra work.
Browser-test depth is still maturing compared to Checkly or Datadog, and complex multi-step flows can hit ceiling features sooner than expected. Best fit: small product or QA teams who want one tool to cover monitoring, alerting, and incident response.
Grafana Cloud Synthetic Monitoring
If your team already runs k6 for load testing, Grafana Cloud lets you reuse those same scripts as synthetic monitors with no rewrite. The unification across CI load tests, synthetic monitoring, and Grafana dashboards is the cleanest example of script reuse in the category. Engineers write a check once and it runs in three different contexts.
The catch is ecosystem fit. You need to be comfortable in the Grafana world for the value to land. Outside k6 and Grafana shops, the learning curve is steep enough that other tools will be faster to value. Best fit: teams already standardized on Grafana and k6.
UptimeRobot / Uptime Kuma

For early-stage products and side projects, UptimeRobot remains the fastest way to get availability checks running, and its open-source cousin Uptime Kuma covers the same ground when you want to self-host. Both are honest, simple, and quick to set up.
The catch is depth. Transaction monitoring is thin, alert routing is basic, and UptimeRobot’s 2025 Terms of Service change restricted the free tier to non-commercial use. Uptime Kuma is one of the few genuinely capable free synthetic monitoring tools, but it costs you operational overhead since you maintain the host yourself. Best fit: pre-seed startups and teams that need uptime coverage today and will revisit the stack at scale.
Which Tool for Which Team
The 2025 observability market grew at roughly 12% per year, and the number of vendors fighting for that growth means founders and tech leads get pitched constantly. The decision is simpler than the noise suggests once you anchor it to team size and stack:
- Pre-seed or seed startups with one critical flow. UptimeRobot or Better Stack at entry level. Revisit when you cross 10,000 monthly active users.
- Series A or B with a real product team. Checkly. Monitoring-as-code pays back in maintainability within the first quarter, and Playwright reuse means QA and platform engineering can share ownership.
- Scale-up already on Datadog or New Relic. Use the native synthetic module. Switching costs almost never beat the marginal saving from bringing in a separate vendor.
- Enterprise with multi-region SLAs. Dynatrace or Catchpoint. The AI-driven root cause analysis earns its keep when an incident costs six figures.
A practical add-on for any team running synthetic application monitoring at scale is to pair it with deeper system testing on critical releases. Synthetic monitoring will tell you the checkout broke. System testing tells you why a specific code path interacts badly with three downstream services. The two together are how mature teams keep mean time to detection low without flooding the channel with false positives.
For teams shipping AI-powered features, website synthetic monitoring assertions need to cover model output, not just response codes. A 200 OK can still wrap a hallucinated answer or a degraded response, and a standard “page loaded” check will miss it entirely. Assertions for AI outputs belong in a separate LLM testing checklist that runs alongside your synthetic monitors, covering prompt injection, output drift, and degraded responses that pass standard HTTP checks.
Common Pitfalls of a Synthetic Monitoring Rollout
Picking the right tool is the easy half. Most rollouts fail in the first 90 days for reasons that have nothing to do with the vendor on the invoice. Five patterns repeat across teams of every size, and they are all preventable with a little discipline up front:
- Monitoring everything. Teams script 40 flows on day one and mute the alert channel by week three. Start with three: the login, the action that makes money, and the one API contract that breaks production if it changes silently.
- Test accounts that drift. A monitor relying on a seeded user with a specific cart state breaks the first time someone touches the database. Isolate the monitor accounts and reset them on a schedule.
- Single-location checks. One failing region looks identical to a global outage at 3 a.m. Configure “X of Y locations” logic before you turn on paging. Trust is harder to rebuild than uptime.
- Monitors without owners. A check without a named owner becomes flaky, then ignored, then deleted. Assign each monitor to a person, not a team. The same dynamic shows up in microservices performance testing, where the unowned downstream service is almost always where production breaks first.
- A wall between QA and engineering. Monitoring strategy that ignores how customer-facing flows are tested in web application testing cycles ends up duplicating effort. The teams that get the most value treat synthetic checks as the production-side mirror of their critical regression suite.
The Honest Path to a Monitoring Stack That Pays Back
The best tool in this category is the one your on-call engineer does not dread at 2 a.m. Most teams over-buy in month one and under-use the platform by month six. The honest sequence is to pick the simplest tool that covers your three critical flows, script those flows properly, tune alerts until false positives sit under 5%, and only then expand coverage or move up tiers.
Scoping which flows are worth monitoring, writing scripts that survive a UI refactor, and tuning thresholds so the alerts mean something is the work that decides whether your monitoring investment pays back. That is the part where a QA partner who has set this up across dozens of products earns its keep. If you would like help picking the right stack and getting it production-ready quickly, contact us and we will scope it with you.
FAQ
What is synthetic monitoring used for?
Synthetic monitoring runs scripted bots that simulate real user actions, like logging in or completing a checkout, against your production environment on a schedule. It catches dead pages, broken APIs, expired certificates, and regressions in critical flows before real customers hit them.
How is synthetic monitoring different from real user monitoring?
Synthetic monitoring is proactive and controlled, running scripted checks from fixed locations on a schedule. Real user monitoring is reactive, collecting data from actual visitors as they use the app. Synthetic catches problems before users notice. RUM tells you what users actually experienced.
Can synthetic monitoring replace load testing?
No. Synthetic monitoring runs one virtual user at a time to verify a flow still works. Load testing pushes thousands of concurrent users to find capacity limits. They answer different questions: is it working versus will it survive a traffic spike. Mature teams run both.
Is open-source synthetic monitoring good enough for production?
For uptime and basic transaction checks, yes. Open-source tools like Uptime Kuma cover availability and simple flows well. They fall short on multi-step browser checks, intelligent alert routing, and the operational maturity that paid platforms ship by default. Most growing teams outgrow open-source by Series A.
See how a digital growth platform kept production running optimally 24/7 while cutting regression-testing time in half.