
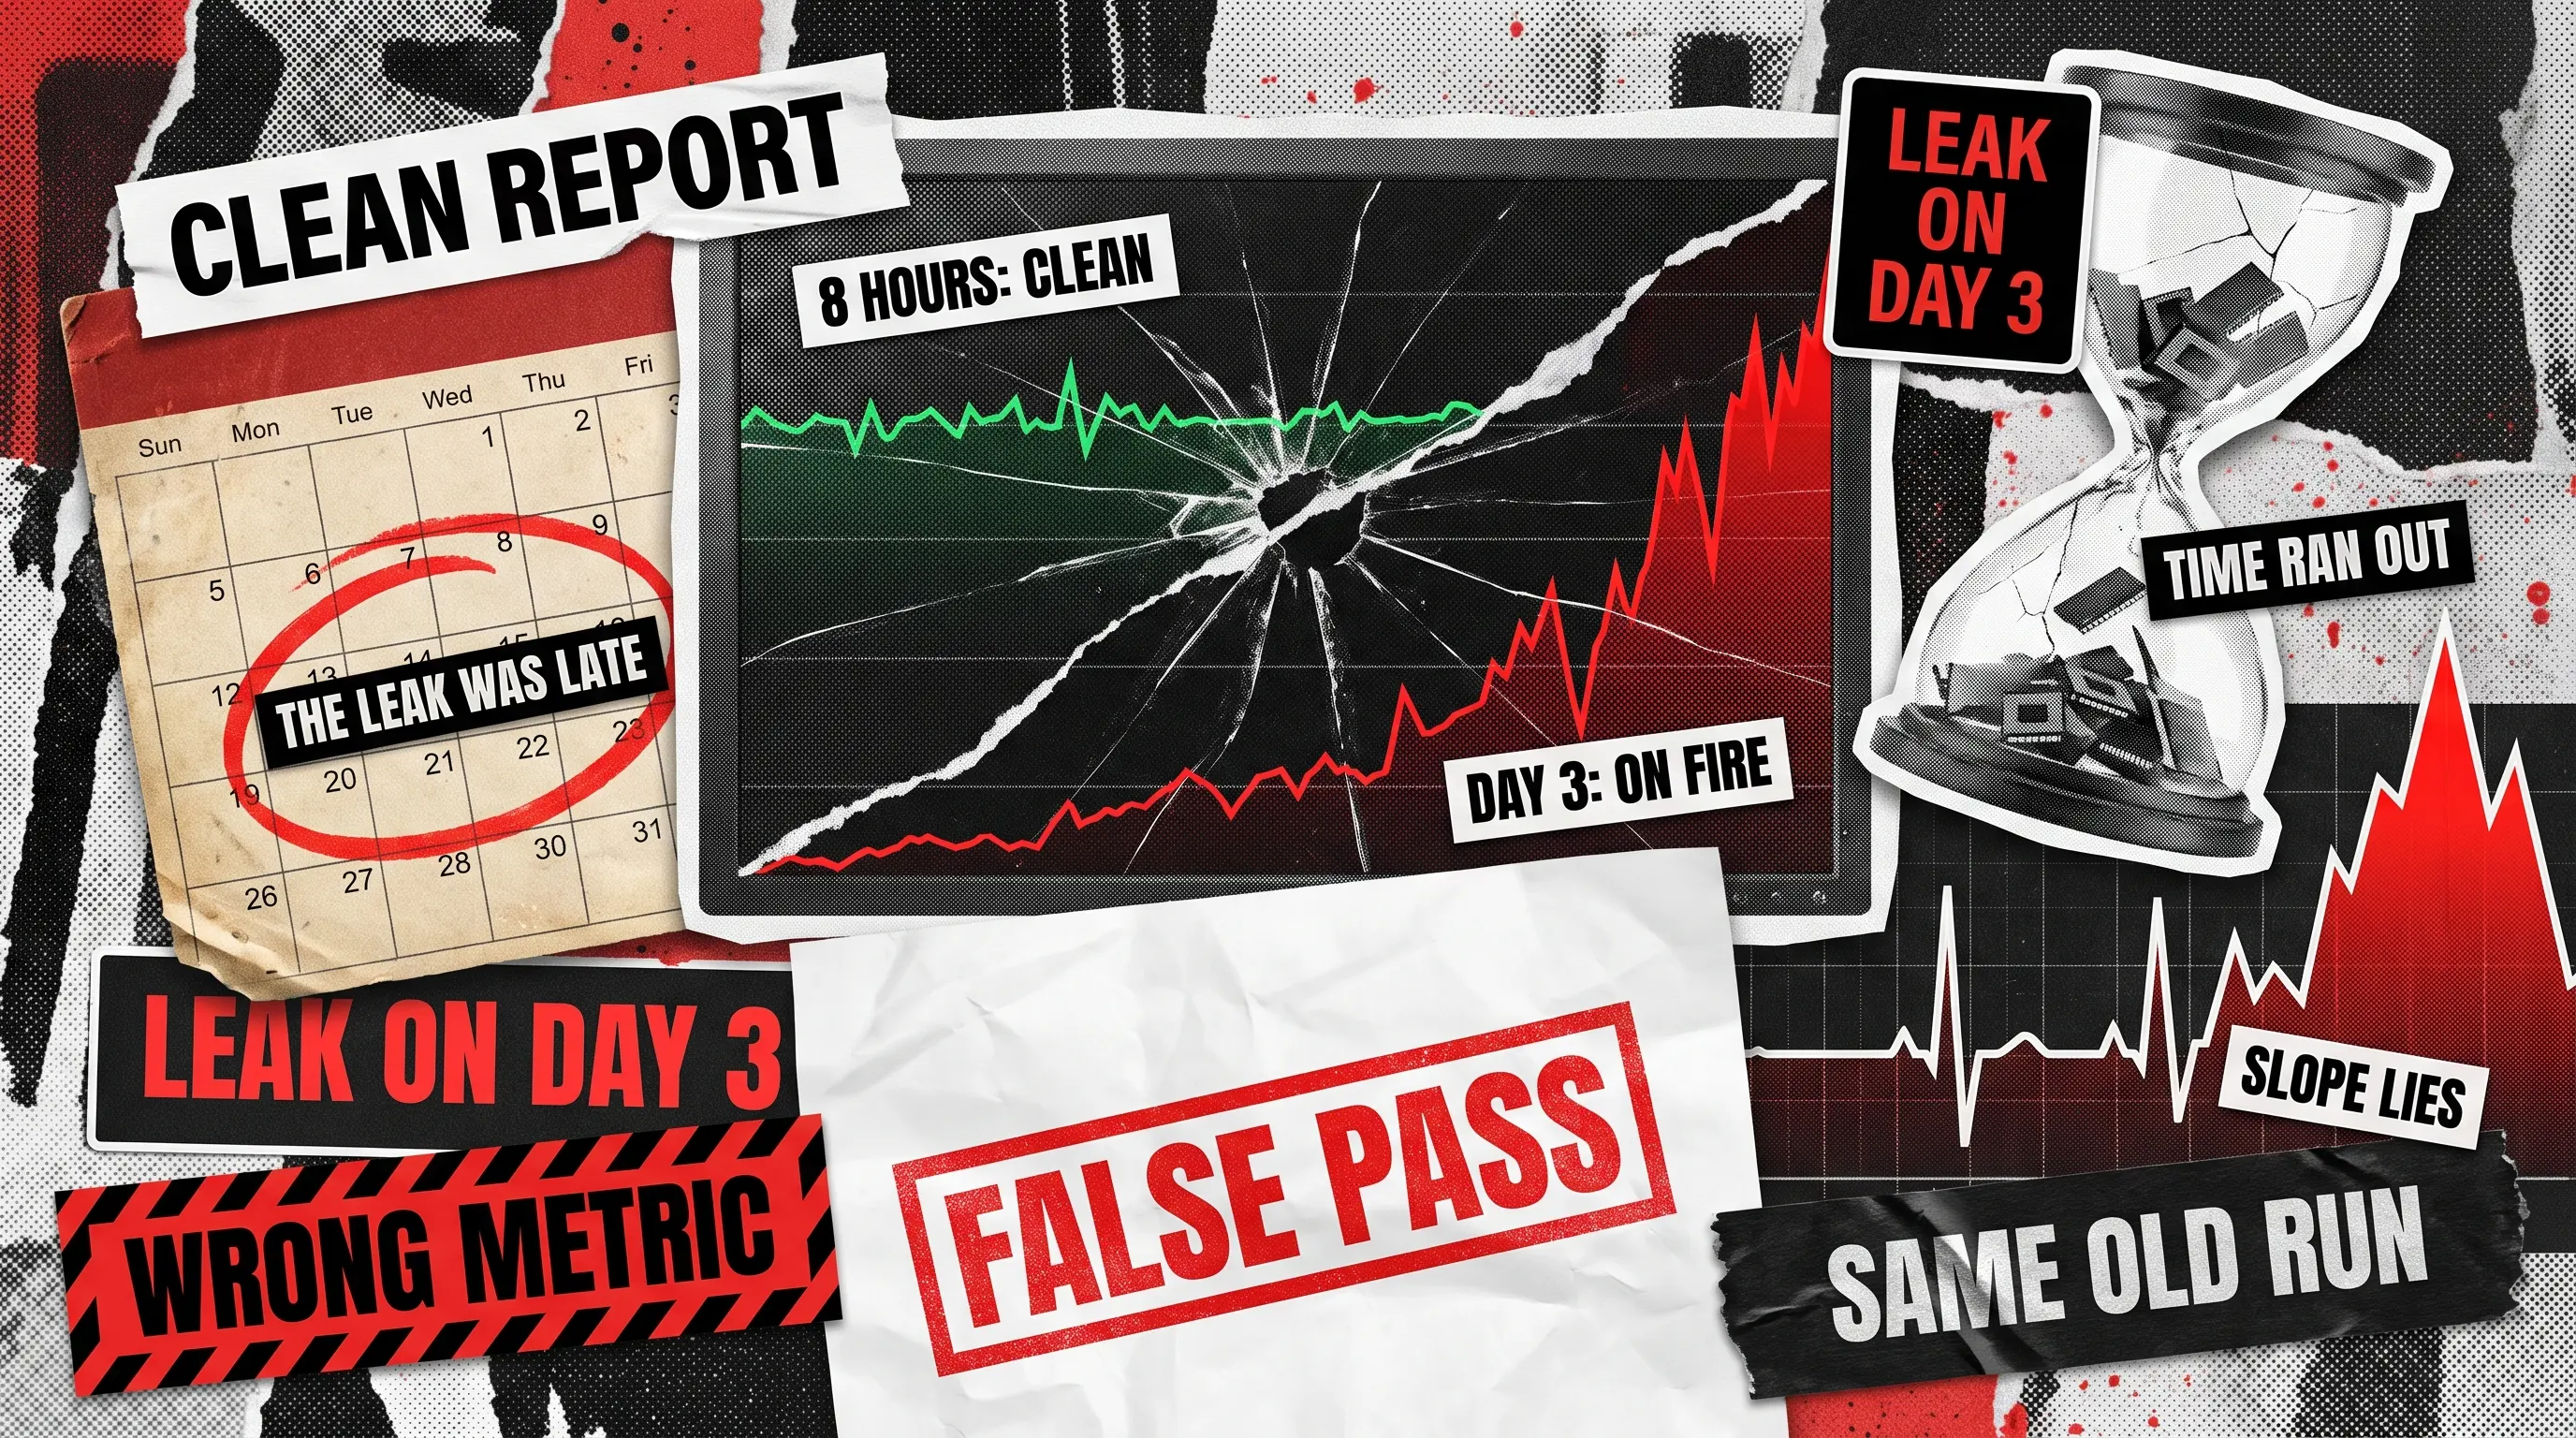
Soak testing has a credibility problem. Teams run it, get a clean report, ship the build, and then watch a memory leak surface in production three days later. The run was not broken. It measured what it was configured to measure. The trouble is that most soak configurations answer a narrower question than engineers think they do, which is why passing runs and leaking production keep coexisting.
This piece is about why that happens and how to design a run that will not. If you are already using soak testing in your pipeline and still shipping leaks, the fix is almost never a longer overnight. The fix is a different shape of test, and it sits inside a broader performance testing practice that treats trajectory as the passing criterion rather than duration. Recent industry data makes the stakes concrete: New Relic’s survey put the median cost of an operational shutdown at $33,333 per minute, with a $76 million median annual bill from outages. A single leak that surfaces on day three is a P&L event.
Why Passing Soak Tests Still Leak
The gap between a passing dashboard and a production incident almost always traces to one of two mistakes. Either the test cannot see the leak because it is not looking at the right metric, or it cannot see the leak because it never triggered the code path that leaks in the first place.
Most guides answer this by prescribing a duration. Eight hours, twelve, seventy-two over a weekend. That prescription is what puts leaks into production. A leak with a 40-hour doubling time looks flat for the first 8 hours, mildly interesting at 20, and terrifying at 60. A test that ends at hour 8 with a linear-looking curve is not evidence of a healthy system. It is evidence that you stopped watching too early. The Cockroach Labs State of Resilience 2025 report surveyed 1,000 senior technology executives and found organizations averaging 86 outages per year, with 70% of large enterprises taking 60 minutes or more to resolve each one. Most of those incidents were preventable at the test bench.
Trajectory Over Duration
The frame is small, but everything changes when you accept it. A soak test does not pass or fail based on the final value of a metric. It passes or fails on the slope. If your heap ends at 2.1 GB after starting at 2.0 GB, the interesting question is not the delta. The interesting question is whether the slope of the post-garbage-collection floor is statistically distinguishable from zero across the last 60% of the run.
That framing changes what you build. You stop asking “how long should the run be”, and start asking “what is the smallest per-hour growth I need to detect, and what run length gives me the sensitivity to detect it above noise.” You stop asking “did the graph look flat”, and start fitting regressions. You stop trusting a single dashboard and start correlating heap, garbage collection (GC) pause duration, connection pool high-water mark, and file descriptor count against the same time axis.
Everything below is a specific way the trajectory framing plays out. Four blind spots, four metrics, four design choices.

The Four Blind Spots
Most short, uniform runs miss leaks for one of four structural reasons. Each has a diagnostic signature, and each has a fix that does not involve making the run longer for its own sake.
Too Short for the Doubling Time
A leak that doubles every 36 hours is invisible inside an 8-hour window. The curve is in its flat early-exponential zone. By hour 40 in production, it is a wall. This is the single most common reason soak testing in software testing misses what it was built to catch.
The signal you actually want is not raw heap. Raw heap oscillates with every allocation and collection cycle. The signal is the post-GC heap floor, sampled every 5 minutes, with a linear regression fitted across the last 60% of the run. If the slope is greater than zero at p < 0.05, you have a leak, regardless of how modest the absolute number looks.
The design fix is to set your run length by sensitivity rather than convention. Decide the smallest per-hour heap growth that would matter in production, then compute the minimum run length that lets you distinguish that slope from GC jitter. If you cannot tell 2 MB per hour apart from noise inside your current window, your window is too short, and no amount of staring at the graph will fix it.
Flat Load, Real Traffic Has Shape
Production traffic has peaks and troughs. Off-peak is when garbage collection gets aggressive, when connection pools drain, when cache eviction kicks in and fires whatever listeners are hooked to it. Leaks that hide behind GC pressure at peak get exposed at trough. Leaks that only trigger on cache eviction never allocate under a flat 100-VU load, because the cache stays hot and nothing ever evicts.
A uniform load also masks the metric you should be watching most closely: GC pause duration and frequency across the load curve, not the run-wide average. What you are looking for is pause-duration drift correlated with load-shape transitions. Averages hide the drift; the transitions expose it.
The fix is to shape the soak to match your actual traffic curve. Ramp up, hold at peak for a couple of hours, drop to 20% for 90 minutes, ramp back. Repeat the cycle across the run. If your production has a nightly quiet hour, put a quiet hour in the test. A flat line on the load generator is a load test with soak-length ambitions, not a real soak.
The Scheduled Job You Forgot to Run
The code paths most likely to leak are the ones that run rarely: cron jobs, midnight reconciliation, weekly report generation, hourly Kafka rebalance, nightly database vacuum. They get fewer reviews, they allocate large transient structures, and they hold references longer than they should. And they almost never appear in the soak scenario, which typically covers only the HTTP request flow.
Here, the metrics to overlay on the timeline are step functions rather than slopes:
- Connection pool high-water mark is sampled around each scheduled job execution.
- File descriptor count before, during, and after the job.
- Thread count if the job spawns workers.
- Any queue depth the job produces or consumes.
If any of these ratchet upward at each job execution and never come back down, you have found a leak that the traffic-only run would never surface.
The design fix is a change of definition. Your scenario is not “traffic.” It is “traffic plus the calendar.” Enumerate every scheduled job that would fire during a production week and either compress its schedule into the test window or trigger it explicitly at realistic intervals. A run that never executes a full cycle of your slowest scheduled job is a load run with soak-length ambitions.
Restart Policy Mismatch
This is the subtlest one and the one most often missed. Test environments are aggressively recycled. CI spins a fresh container per run. The orchestrator kills anything with a 5xx spike. Health-check thresholds are tuned tightly for fast feedback. Production, by contrast, may run for 30 days between restarts. A leak that would take 200 hours to matter never gets a chance to matter in a test that resets on hour 12 because a health check flapped.
The metric to watch is trivial: container or process uptime alongside the leak metric. Any restart during the run invalidates the trajectory from that point forward. Yet in most CI setups, this correlation is never plotted, and the run is marked green because the metrics after the restart happened to look fine.
The fix is to match production’s restart policy in the test environment, not CI’s. Widen liveness thresholds. Disable aggressive health-check killing for the duration of the run. Treat any mid-run restart as a failed soak test, requiring investigation and rerun, rather than as a hiccup you dashboard past. If your orchestrator would tolerate a 30-day process in production, your test bench should tolerate one for the length of the run.
What a Real Soak Test Looks Like
Use this as an audit list for your next run. If your current pipeline fails on more than three of these, the eight-hour number is not your problem.
- Run length is set by target detection sensitivity, computed from acceptable per-hour growth, not by “overnight”
- Load curve is shaped to mirror production, with peaks, troughs, and transitions, rather than a flat plateau
- Every scheduled job that would fire in a production week is either compressed into the run window or triggered explicitly
- Restart and liveness policy in the test environment matches production, not CI defaults
- Post-GC heap floor is the primary heap signal, not raw heap, and it is fitted with a linear regression across the last 60% of the run
- Connection pool high-water mark, file descriptor count, and thread count are plotted as time series with the same axis as the load and job schedule
- GC pause duration is tracked across the load curve, not summarized as a run-wide average
- Any mid-run process restart automatically invalidates the run and requires investigation before it can be marked green
- The passing criterion is written as a slope threshold and a high-water-mark ceiling, not as “the graph looked flat”
Miss any one of these, and you have built a run that can produce a false green. Get all nine and the runs that pass will mean something.
Where Soak Fits with the Rest
Sustained-load testing answers one question: what accumulates over time. It does not replace the other performance disciplines, and it depends on them. Load testing tells you whether the system holds peak throughput; without that baseline, a shaped soak has no target load to hold. Burst behavior is a separate question entirely, and if you have not stressed the system with sudden traffic, you are shipping blind into every marketing launch, viral event, and Monday-morning login rush.
Distributed architectures add their own dimension. A monolith leaks in one process; a mesh of services can leak in the ways they talk to each other, and the trace has to follow the request across every hop. Running sustained-load runs across microservices with distributed trace correlation is a different discipline from soaking a single service, and it deserves its own scenario design. The same is true one layer down at the interface: the API-level bottlenecks that show up under sustained load amplify every failure mode in the four blind spots above, because a slow contract compounds every leak the workload triggers.
Design for Detection Sensitivity
The eight-hour number is a comfort blanket. What matters is whether your run can see slope in the metrics that leak: post-GC heap floor, pool depth, file descriptor count, GC pause duration, across load shapes and scheduled jobs that mirror what production actually does. Design for detection sensitivity. If your last run passed and production still leaked, the next one does not need to be longer. It needs to look at the right thing, in the right shape, with the right restart policy. When you are ready to build one that actually catches the leak, contact us, and we will design it with you.
FAQ
How long should a soak test run?
Long enough to distinguish the smallest per-hour resource growth that would matter in production from garbage-collection jitter. If a 2 MB per hour heap slope would take your service down in a week of uptime, your run needs to be long enough to detect that slope above noise with a linear regression on the post-GC floor. That is usually longer than 8 hours and often shorter than 72.
What is the difference between soak testing and endurance testing?
They are the same practice under two names. Some teams and vendors prefer “endurance,” and some prefer “soak”; the disagreement is regional and stylistic, not technical. Both mean sustained load over an extended period, watching for accumulation.
Why did my soak test pass but production had a memory leak?
Almost always one of four reasons: the run was shorter than the leak’s doubling time, the load was flat while production has a diurnal shape, the run never executed a scheduled job that leaks, or the test environment restarted a process the orchestrator would have kept alive in production. Fix the design, not the duration.
See how QAwerk kept 8 content-heavy portals stable under sustained traffic from 110 million students a year, before Keystone scaled further.