
Test coverage percentage is the easiest automation number to put on a slide, and one of the least useful on its own. A suite with 90% coverage that runs for an hour and fails at random tells you less than a smaller suite your team believes on every merge. The cost of misreading it is paid in engineer hours: every unexplained red build means someone reruns the pipeline, reads the logs, and decides whether to trust the result.
The test automation metrics that actually matter are flaky test rate, suite execution time, maintenance cost, and pass rate trend across releases. Together they show whether developers trust the results, whether feedback arrives fast enough to act on, and whether the suite is getting cheaper or more expensive to keep. Coverage is useful context for reading them.
If your automated testing runs without a dedicated team to own it, the metrics below are also the fastest way to see where the suite is costing you time.
Why Coverage Percentage Alone Is Misleading
Coverage measures breadth. It tells you how much code, or how many test cases, the suite touches, and nothing about whether those tests would catch a real regression. A suite can reach 100% line coverage of getters and configuration code while the checkout flow, the permission model, and the data migration go untested.
The number is also easy to inflate. Tests without meaningful assertions, tests that only confirm a page loads, and checks duplicated across layers all raise coverage without raising confidence. Once coverage becomes a target, teams write the tests that move it fastest, and those are rarely the ones that protect revenue.
According to the Capgemini World Quality Report 2025-26, just one-third of test cases are automated on average, and only 4% of respondents automate 76% to 100% of their test cases. The same report recommends replacing “% of tests automated” with indicators tied to customer impact, release velocity, and defect containment.
A more useful version of coverage is critical-journey coverage: the share of flows that would cost you users or revenue if they broke, each protected by at least one reliable check in your automated functional testing. Agreeing on that list is the first step of the strategic QA assessment that opens every QAwerk automated testing engagement.
Test Automation Metrics at a Glance
Each metric below answers a different question about your suite: can you trust it, is it fast enough, and is it worth what it costs to keep. None of them works well alone. A low flaky rate means little if the suite skips your riskiest flows, which is why critical-journey coverage sits in the same table.
Flaky test rate
Whether a failure can be trusted
Tests that both passed and failed on the same commit, divided by tests run, over the last 50 to 100 runs
The rate rises, or reruns become routine
Suite execution time
How fast developers get feedback
Median and slowest pipeline run per release, plus time from push to first result
Runs get slower without protecting more critical journeys
Maintenance ratio
What the suite costs to keep
Hours repairing existing tests divided by hours writing new ones, per sprint
Repairs outpace new tests for several sprints in a row
Pass rate trend
Whether quality is improving or degrading
First-run pass rate per release, with every failure triaged as product defect, test defect, or environment
The trend falls, or “test defect” becomes the most common verdict
Critical-journey coverage
Whether the risky flows are protected
Critical journeys with a reliable automated check, divided by all critical journeys
Gaps in payment, permission, or data-integrity flows
Raw coverage %
How much the suite touches
Lines, branches, or test cases covered
It is the only number anyone reports
How to Measure Flaky Test Rate
A flaky test passes and fails on the same code with nothing changed in between. Flaky test rate is the share of tests that did both within a window, typically the last 50 to 100 pipeline runs or the last two weeks. Track it per test as well as for the whole suite, since a few tests usually produce most of the noise.
It earns the central spot among test automation metrics because it decides whether anyone reads the results. Once developers learn that a red build often means nothing, they rerun until it turns green and start merging past failures, and real regressions hide among the false alarms. In a 2023 Gartner Peer Community survey of 248 IT and software engineering leaders, 31% named inaccuracies in automated testing among their most significant challenges, and 21% cited a lack of trust in automation tools or vendors.
Three numbers are worth tracking together:
- Flaky test rate: tests with mixed results on the same commit, divided by tests run.
- Rerun rate: pipeline runs that needed a retry before passing.
- Quarantine age: how long flaky tests have sat outside the main suite without a fix.
Count the first attempt. Automatic retries hide flakiness from the pass rate, so a suite that only goes green on the second try can report zero failures while costing the team a rerun on every merge. Our guide to flaky tests covers the causes and the fixes; the metric tells you whether the problem is growing or shrinking.
Execution Time and Maintenance Cost as Test Automation ROI Metrics
Automation pays off when it delivers faster feedback than manual checks for less ongoing effort. Execution time and maintenance cost measure those two halves directly, which makes them more honest test automation ROI metrics than a projected “hours saved” figure. In the same Gartner Peer Community survey, 23% of leaders reported hard-to-define ROI as a significant challenge, and 16% named high maintenance costs.
Execution Time
Track the median and the slowest run per release, plus the time from a push to the first result. The warning sign is a suite that slows down without protecting anything new, usually because of end-to-end tests that duplicate checks better made one layer down. Automated API testing is often where that time comes back: a business rule checked through the UI waits on logins, page loads, and rendering, while the same rule checked against the endpoint skips all of them.
Maintenance Cost
Log the hours spent repairing existing tests separately from the hours spent writing new ones. When repairs consistently take more time than new coverage, the suite is consuming the capacity it was supposed to free up. Common causes are brittle selectors, tests that share data, and interface text hardcoded into assertions. That last one is a familiar problem in localization automation testing, where every new language can break dozens of assertions at once unless locale strings live in resource files.
Framework design decides much of this cost up front. Patterns like the Page Object Model keep a UI change to one file instead of every test that touches that screen. Scope decides the rest: our guide to automated regression testing covers what to automate and what to leave to people. Stable, high-traffic flows earn automation, and scenarios that depend on hardware, third-party interfaces, or frequently changing layouts usually cost more to maintain than they save.
Why Pass Rate Trends Matter More Than a Single Snapshot
A single 95% pass rate says little about suite health. What matters is how the number changes from release to release. If the pass rate drops from 99% to 95% over three releases, something is getting worse. If it stays at 95% but different tests fail each time, the suite itself is probably unstable.
Track the first-run pass rate per release and triage every failure into one of three groups: a real product defect, a test defect, or an environment problem. A growing share of product defects means the suite is catching regressions and the code needs attention. A growing share of test defects and environment failures means the suite itself is degrading.

Then connect the trend to what happens after release. DORA, Google’s DevOps Research and Assessment program, defines change fail rate as the ratio of deployments that need immediate intervention, such as a rollback or a hotfix. If your pass rate stays high while change fail rate climbs, the suite is passing builds that still carry production defects. This matters more as AI speeds up development: the 2025 DORA State of AI-Assisted Software Development report found that AI adoption now improves software delivery throughput but still increases delivery instability.
When These Metrics Can Mislead
Every metric here can be gamed or misread. Deleting flaky tests lowers the flaky rate and also removes protection, so read the rate alongside critical-journey coverage. A short execution time can mean an efficient suite or one that skips the slow, important checks. Maintenance ratios look worst during a major redesign, which is a legitimate reason for a temporary spike. Suite metrics also say little about product quality on their own, so read them next to wider QA measures such as defect density, defect containment, and schedule adherence, covered in our overview of the most important software test metrics.
Early-stage products are the other exception. If the interface changes every week and only a few flows are stable, heavy UI automation mostly measures churn. A small set of API checks plus structured manual regression is usually the better investment until the product settles.
How QAwerk Keeps Automated Suites Worth Trusting
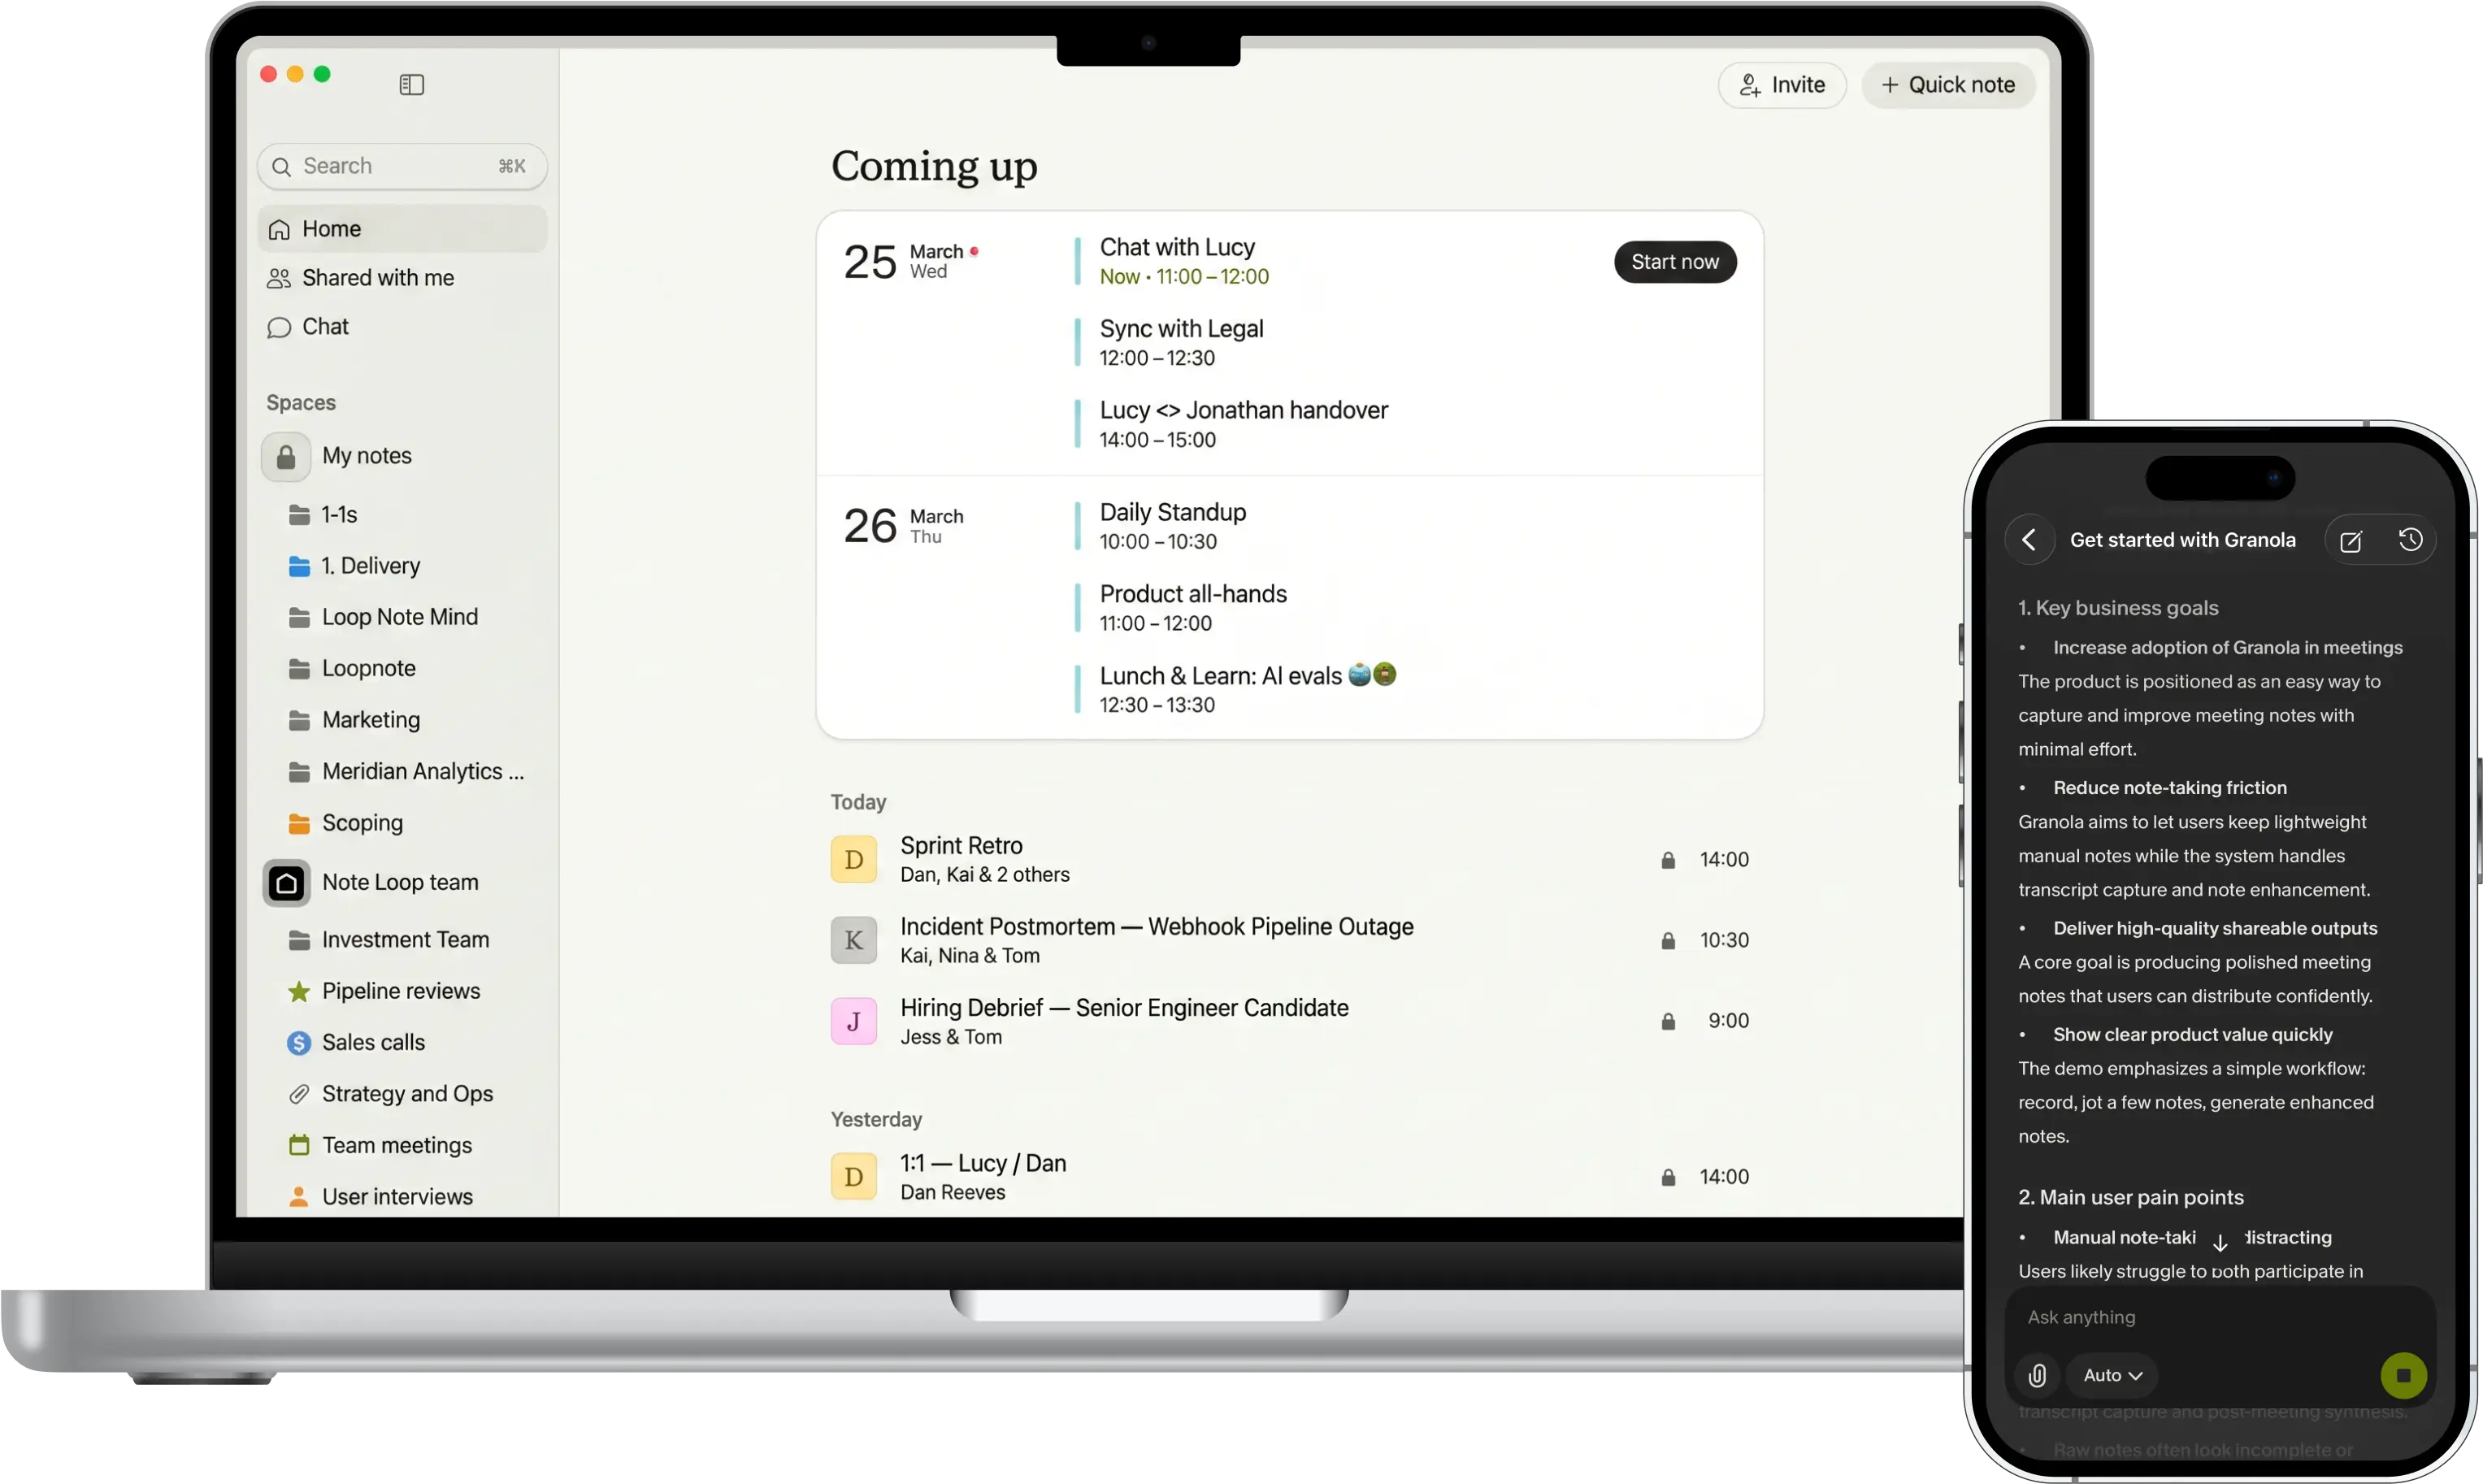
For Granola, an AI notepad that ships updates every week, QAwerk built a test automation framework from scratch and automated 76% of the core regression suite, the 150+ checks that run before every release. A big part of that result came from deciding what to keep out of the suite:
- Hardware-dependent audio scenarios and external payment flows went to manual testers, to keep the automated suite fast and reliable.
- Unstable third-party logins such as Google SSO were replaced in tests with an internal authentication helper, to prevent false failures.
- AI-generated summaries, which differ on every run, are checked by an LLM for context and accuracy, since exact-match assertions would fail constantly.
- Execution runs in parallel on macOS and Windows through GitHub Actions, nightly or before a merge, with results posted to Slack.
Each of those choices targets flaky rate, execution time, or maintenance cost, and together they let Granola keep a weekly release schedule. We can start at any stage: building a suite from scratch, as on Granola, or taking over one that already exists and getting its flaky rate and maintenance ratio under control before adding more tests. For companies without in-house QA, a dedicated testing team can own the suite long term, so someone tracks these metrics on every release.
Judge Automation by Trust and Maintenance Cost
A healthy automated suite is one your developers believe when it fails and your budget can afford to keep. Flaky, slow, expensive tests can post excellent coverage numbers while delivering little of what automation promised. Start with the first-run flaky rate and the maintenance ratio for your last few sprints; between them, they show where your suite stands.
If you want a QA team to audit your suite against these metrics, or to build one your engineers will keep using, talk to QAwerk.
FAQ
What are the most important test automation metrics?
Flaky test rate, suite execution time, maintenance ratio, and first-run pass rate tracked across releases, plus coverage measured against your critical user journeys. Together they show whether the suite is trusted, fast enough to act on, and affordable to keep. Raw coverage percentage is useful context but a weak target on its own.
What is a good flaky test rate?
There is no universal benchmark, because the rate depends on how you define the window and the suite. A practical rule is to treat any test that changes result on an unchanged commit as a defect with an owner and a deadline, and to watch the trend: a rate that rises release over release is the signal to act.
How do you measure test automation ROI?
Compare what the suite costs to run and maintain (execution time plus hours spent repairing tests) with what it replaces (manual regression time) and what it prevents (changes that fail in production). Tracking the maintenance ratio and change fail rate over several releases gives a more honest picture than a one-time “hours saved” projection.
Is test coverage a useless metric?
No. Coverage shows how much of the product the suite touches, which helps spot untested areas. It becomes misleading when it is the only target, because it rises just as easily with trivial tests as with valuable ones. Measuring coverage against a list of critical journeys keeps it useful.
See how we built and maintained 1,100+ test cases for Granola, an AI notepad, and automated 76% of its regression suite