Every app crash is a silent goodbye, and on mobile, users rarely give you a second chance. Mobile app crash reporting closes that gap by replacing guesswork with the exact details of what broke, on which devices, and for how many people.
This guide lays out a practical, QA-led strategy for catching, diagnosing, and reducing crashes, written for the people who actually have to act on the data: CTOs, QA leads, QA analysts, and product managers. If you would rather hand the whole quality problem to specialists, our mobile application testing team does this every day, but the principles below will serve you well either way.
What Is Mobile App Crash Reporting?
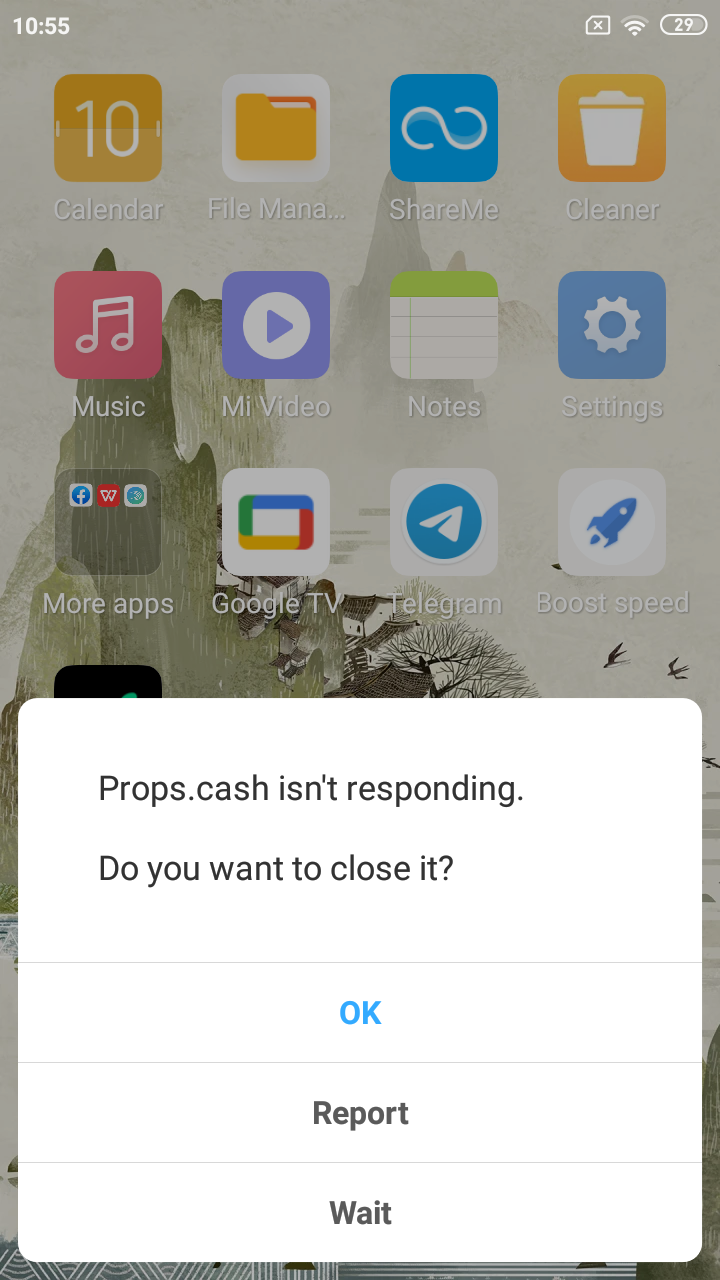
Mobile crash reporting is the practice of automatically capturing diagnostic data the moment your app fails, then sending that data to a dashboard your team can analyze. Instead of relying on a user to describe what happened (which usually amounts to “it just closed”), a crash reporting SDK records the failure, the device, the app state, and the exact code path that died.
A good report bundles together a stack trace, a log of recent user actions, and a snapshot of the device environment. That bundle is the raw material for mobile app crash analytics, the discipline of turning thousands of individual failures into patterns, priorities, and decisions. Crash reporting shows you exactly what broke, while crash analytics helps you figure out why it happened.
Why Mobile Crash Reporting Matters More Than Most Teams Admit
Here is the uncomfortable truth: users are ruthless, and both Google Play and App Store are a graveyard of almost good enough products. Google has been explicit about this. Its Google Play quality program sets a “bad behavior” threshold where a user-perceived crash rate above 1.09% of daily active users can make your app harder to discover, and a single device model crossing 8% can trigger a warning right on your store listing. Staying below those limits is precisely what Google Play compliance testing is built to protect. Google has also said its newer quality metrics correlate more strongly with uninstalls than the old ones did. Translation: crashes do not just annoy users, they throttle your growth.
It has long been observed in software engineering that a defect caught early costs a fraction of what it costs after release, when it has to ricochet back through the entire development cycle. Mobile crash reporting is how you catch and kill those defects before they snowball into refunds, one-star reviews, and churn.
A Step-by-Step Mobile App Crash Reporting Strategy
A strategy is more than installing a tool and hoping for the best. The teams that actually reduce crashes treat reporting as a loop: instrument, capture context, prioritize, reproduce, validate, repeat. The six steps below walk through that loop with hands-on examples and the caveats that trip people up. Follow them in order and you will spend far less time playing detective and far more time shipping confidently.
Step 1: Instrument the Application and Set a Baseline
The first phase of your strategy involves successfully integrating the mobile crash reporting software deeply into your product codebase. This foundational step requires close, continuous collaboration between the core development team and the quality assurance department. Before writing a single line of automated test code, QA engineers should consult a comprehensive mobile app testing checklist to ensure all critical testing parameters and reporting thresholds are clearly defined.
Once the analytics software development kit is active in your staging environment, you must establish a performance baseline. This crucial process means observing how the application behaves during normal, crash-free usage across a variety of test devices. Establishing this baseline allows testers to easily spot statistical anomalies and massive crash spikes when a new build officially drops.
A common caveat at this stage is failing to initialize the reporting tool early enough in the application startup lifecycle. If a fatal crash occurs during the initial boot sequence before the analytics tool fully initializes, you will lose the diagnostic report entirely, leaving you with a silent failure.
Step 2: Turn Stack Traces Into Root-Cause Maps
Once data is flowing, the single highest-value artifact in any report is the stack trace. Rather than guessing which button or API call broke the app, you get a step-by-step roadmap of what the code was doing at the exact moment it died, often down to the file and line number. This is what lets a QA engineer write “it broke in this method” instead of “it broke somewhere,” which drastically cuts the ping-pong between QA and development.
Take a crash our team found while manually testing a hospitality app. A user simply lands on the homepage and taps the refresh icon, and the whole app falls over. There is no warning, no error message, and from the outside it looks random. A clean stack trace turns that random failure into a specific, fixable line of code, and pairs perfectly with reproduction steps a QA engineer can hand straight to a developer.

The caveat: stack traces tell you where, not always why. A null value, a race condition, or a third-party SDK can all surface at the same line. Treat the trace as your strongest lead, not a confession.
Step 3: Follow the Breadcrumbs to Reproduce Failures
One of the hardest parts of QA is remembering the precise sequence of taps, swipes, and background switches that triggered a failure. Most modern crash reporters solve this with “breadcrumbs,” a chronological log of user actions leading up to the crash. If a failure only appears after a user opens a menu, taps through three screens, and then triggers an action, the breadcrumbs map that path for you.
This is exactly the kind of crash breadcrumbs were made for. Our testers found a failure in an Android AI app that only appears at the end of a very specific path: open the side menu, tap the three dots, go into the Help Center, choose Copy Email Address, then tap Copy. A real user who hits this would probably just tell you the app crashed somewhere in the Help Center, leaving you to guess the rest. Breadcrumbs record each of those taps automatically, so instead of guessing you get the precise sequence you need to reproduce the bug and prove it is fixed.
Your tracking is only as good as your setup. If you don’t tell the system to log a specific action, like opening a checkout page, it won’t. Always make sure you map out all critical user steps beforehand.
Step 4: Beat Fragmentation With Environment Snapshots
Mobile testing is a minefield of fragmentation. An app can run beautifully on a flagship phone and crash instantly on a budget device with an older OS. This is where environment snapshots prove their worth, because crash reports automatically capture the device model, OS version, screen orientation, battery level, memory usage, and network status at the moment of impact. You can instantly see whether a bug is global or isolated to one corner of the device matrix, which saves hours of blind cross-device testing.
This split is exactly why Android crash reporting and iOS crash reporting deserve separate attention rather than one blurry average. Android’s open device ecosystem produces a long tail of older hardware, while iOS fragmentation tends to cluster around OS versions and a smaller device set. A login crash our team found on an older Android phone running a years-old OS is a perfect example: on newer hardware the flow worked, but on the legacy device the app died right after the user signed in with Google. Without the environment snapshot, you would never know the bug was device-specific.
The caveat is coverage. Snapshots only describe the devices that actually ran your app, so if your real users skew toward hardware your team never tests, you are flying blind on the exact phones most likely to fail. Dedicated iOS application testing and Android app testing on real devices close that gap before users have to.
Step 5: Triage by User Impact, Not by Panic
When a new build drops, QA teams are often flooded with issues, and not all of them deserve equal energy. The best mobile crash reporting dashboards automatically group identical crashes and attach impact metrics, so you can tell the difference between “this crashed 500 times affecting 120 users” and “this crashed once, ever.” That distinction is the heart of good mobile app crash analytics: it lets you champion the user experience with objective numbers instead of gut feel.
In practice, this means sorting your backlog by who and how many, not by who shouted loudest in the stakeholder channel. A crash that hits 2% of your daily users on a popular device is a release blocker. A crash that fires once on a rooted phone in airplane mode is a footnote. Impact data gives QA the evidence to defend that ranking when a manager wants their pet bug fixed first.
The caveat: raw counts can mislead. A crash affecting a small number of high-value users, say everyone on your checkout screen, can matter far more than a high-volume crash on a screen no one cares about. Always weigh frequency against business context.
Step 6: Pair Automated Reporting With Human Testing and Regression
Crash reporters are brilliant at recording failures that happen, but they cannot dream up the weird scenarios that cause them. That creativity is human work. Every bug example in this article was caught by QA engineers doing hands-on, exploratory testing, then documented with the kind of detail a crash dashboard alone rarely produces. Automated reporting and manual testing are partners, not rivals.
A vivid example is an Android shopping app that did something genuinely alarming. When a tester minimized the app while it was still loading, the failure did not stay contained: the home screen crashed and the phone locked itself, forcing the user to unlock the device again. A purely automated funnel might log the crash and move on, but a human noticed the real-world severity of an app that can take the whole launcher down with it.
This step is also where crash reporting supercharges beta and regression testing. During internal alpha or beta runs you cannot sit beside every tester, but if a stakeholder hits a crash, you can filter the dashboard by their device or user ID and see the diagnostics without interviewing anyone. After a fix ships, the same data confirms the crash signature actually disappeared instead of merely hiding. This blend of stability and performance validation is exactly what we delivered for clients like Unfold, a mobile toolkit for storytellers, the Thirdfort identity verification app, and Fext, where catching failures under real conditions kept releases smooth.
The Best Mobile Crash Reporting Software to Know
There is no single winner, only the right tool for your stack, your budget, and your team’s appetite for setup. Below is a quick, honest tour of the best mobile crash reporting options most teams evaluate. All of them deliver the core ingredients we covered above: stack traces, breadcrumbs, environment data, and impact-based grouping.
- Firebase Crashlytics: Google’s free, lightweight option and a strong default for startups or any team already using Firebase.
- Sentry: a developer-favorite for cross-platform error and performance monitoring with deep release tracking, though its breadth can feel heavy for non-technical teammates.
- Bugsnag (now part of SmartBear): built around stability scores and customizable workflows, which appeals to larger teams that want one clear number for release health.
- Luciq: pairs crash reporting with in-app user feedback, giving QA and support teams both the technical trace and the human context.
- Embrace: a full mobile observability platform that captures sessions, ANRs, and frozen frames across iOS and Android, not just crashes.
One caveat applies to all of them: a tool only reports what you set it up to capture, so your strategy matters more than the logo. A poorly configured premium tool loses to a well-run free one every time.
QAwerk Makes Your Mobile Crash Reporting Work
The hardest part of mobile crash reporting is not buying the tool, it is sustaining the discipline: instrumenting every build, reproducing the weird edge cases, weighting impact correctly, and verifying that yesterday’s fix did not reintroduce last month’s crash. That is the muscle QAwerk has been building since 2015 across more than 300 projects in North America, Europe, Australia, South Korea, and Africa, work that earned us a place among the world’s best QA companies in IAOP’s Global Outsourcing 100.
If your crash dashboard has more questions than answers, let’s fix that together. Contact us and we’ll help you turn raw crash logs into a strategy that actually catches bugs before your users do.
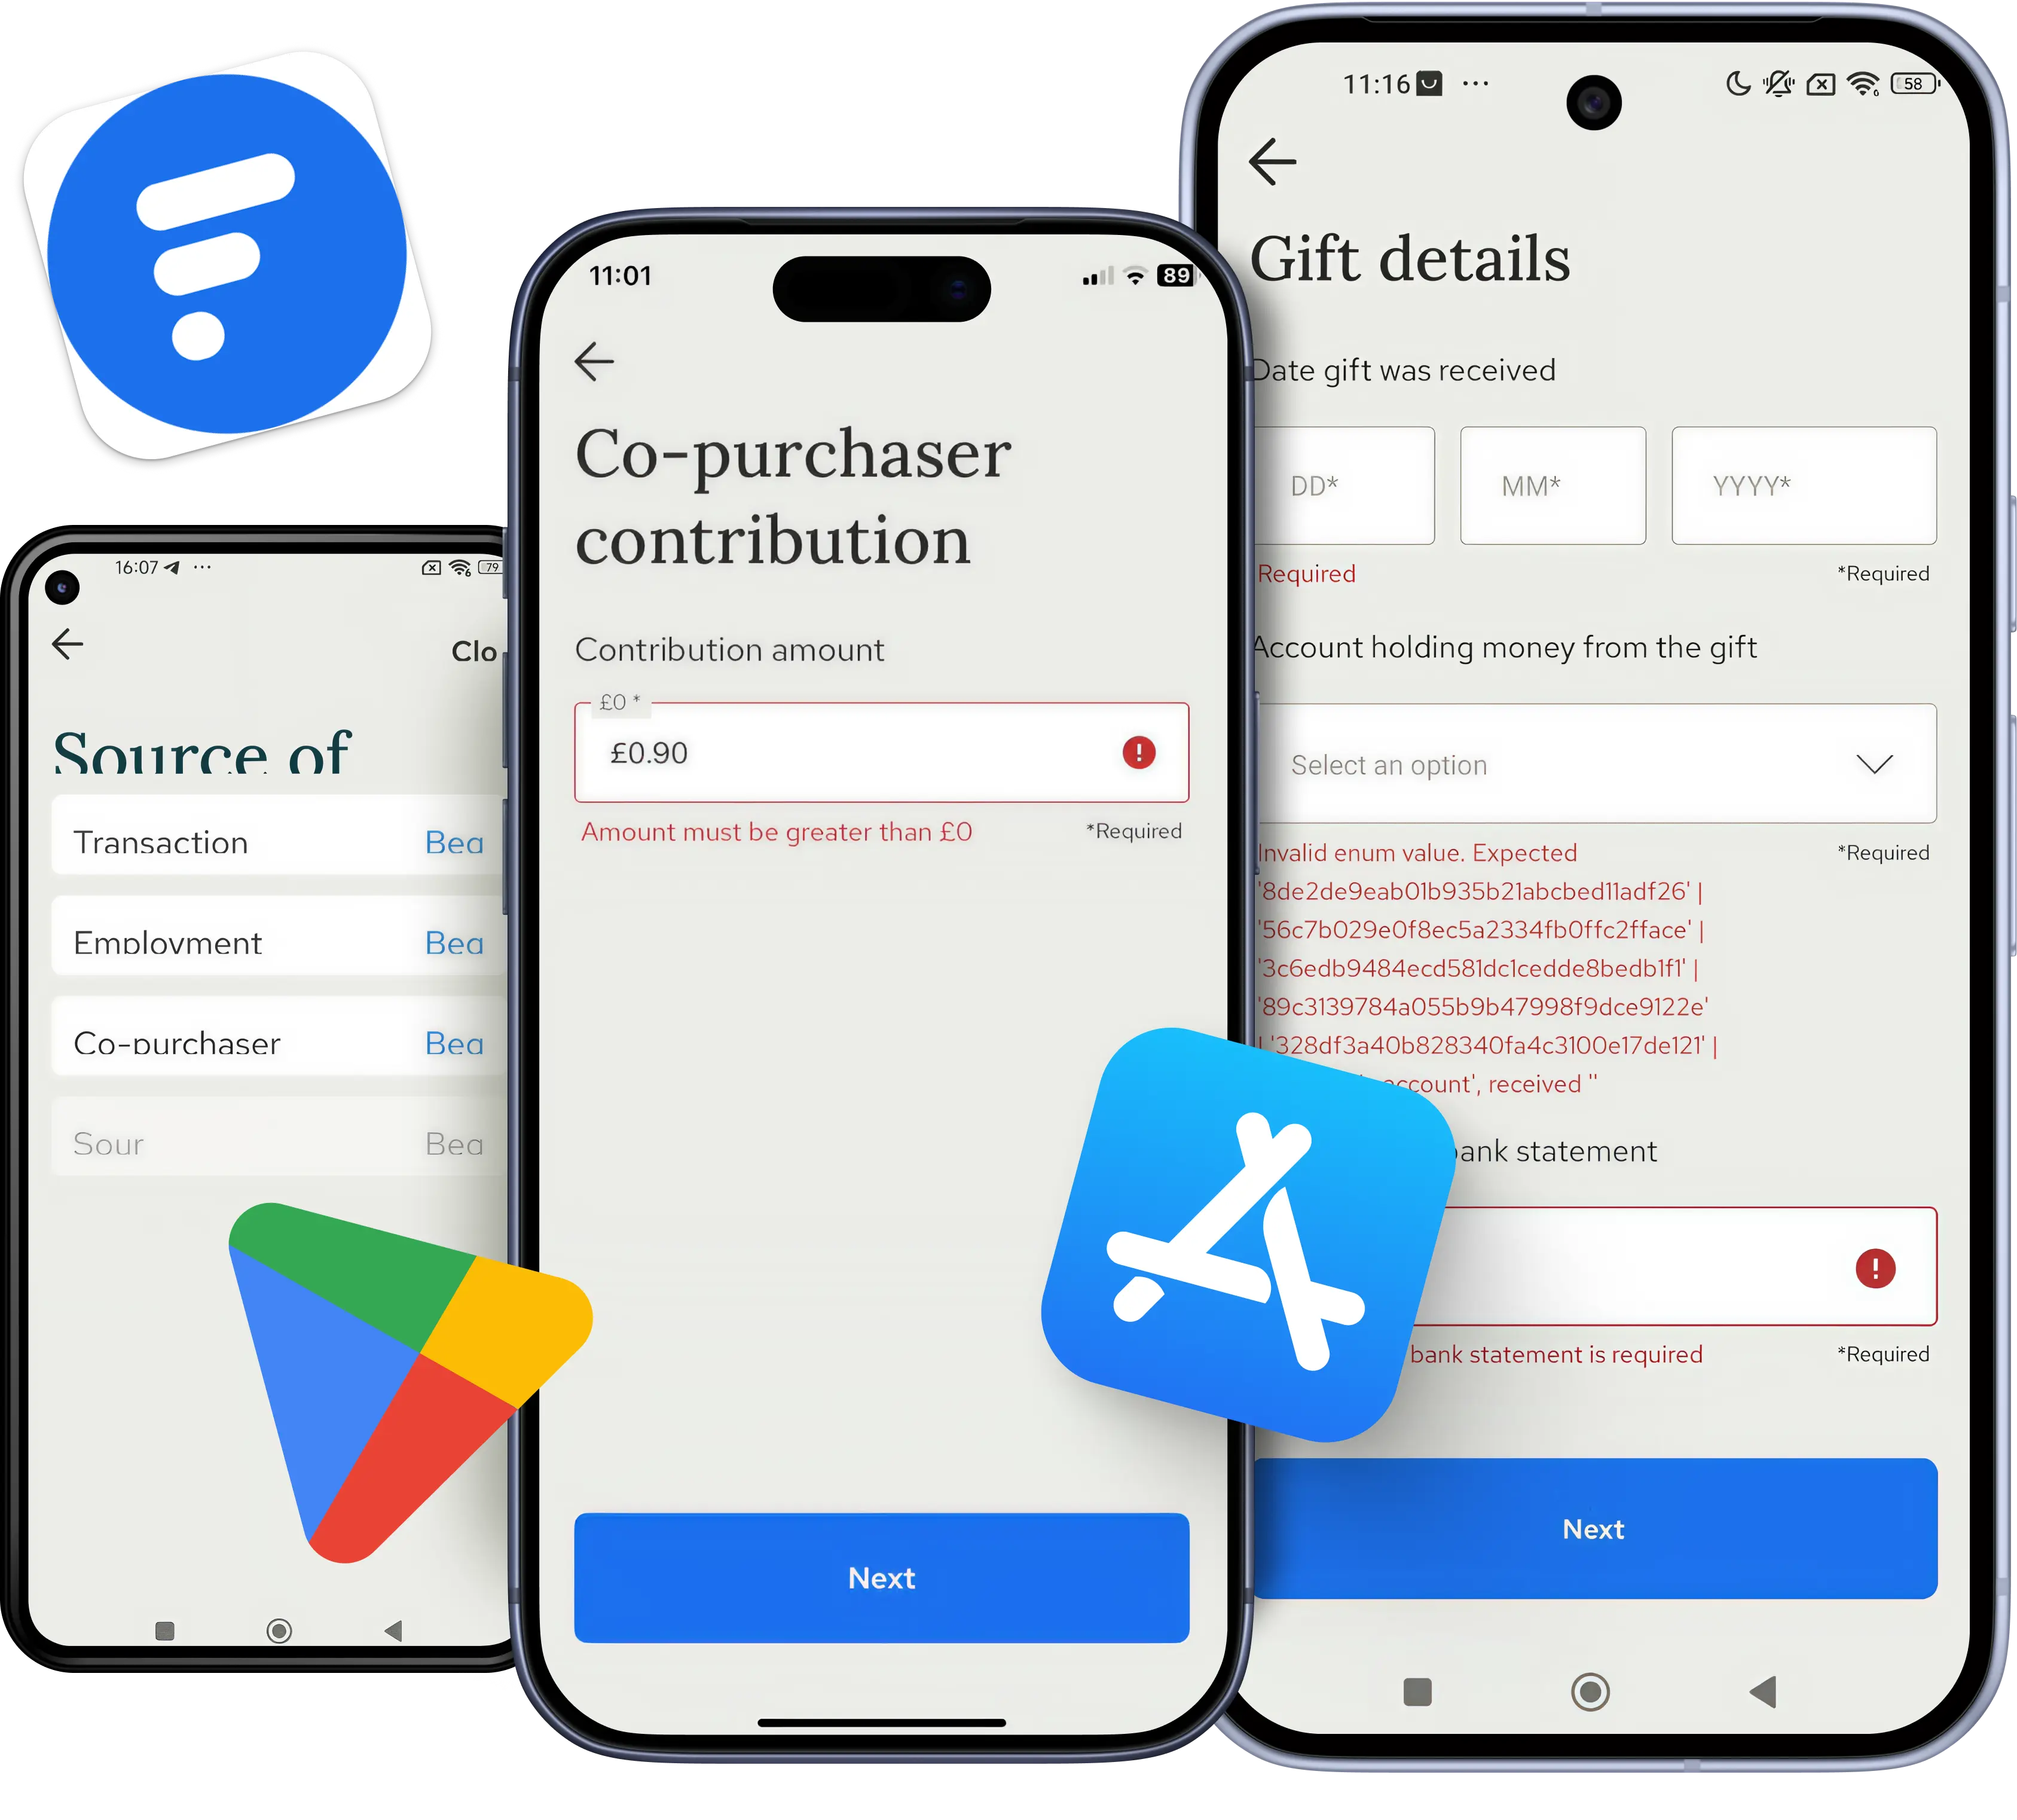
Check out how 20+ regression cycles kept Thirdfort's Source of Funds and compliance workflows crash-free through a full app rewrite